View attendance analytics
Quick answer
- Open Attendance analytics from View analytics on the Attendance page, or a trends tile.
- Read the at-risk banner, the Attendance rate card, and the Trends charts.
- Filter the charts by class and the at-risk table by year group and risk level.
The analytics screen shows attendance patterns, a risk banner, and the at-risk student list. You need Attendance-analytics read access; without it the View analytics button stays disabled.
Open the analytics screen
On the teacher Attendance page, click View analytics (top right). You can also reach it from a View trends tile on a leader or officer dashboard.

Check the at-risk banner
An at-risk banner sits at the top. Its flagged-students action opens the at-risk modal listing the students currently below the attendance threshold.
Read the stat cards
Four cards summarise the picture: Attendance rate (which shows a "below threshold" warning when it drops low), Late students, Unexcused absences, and Absent students.
Explore the trends charts
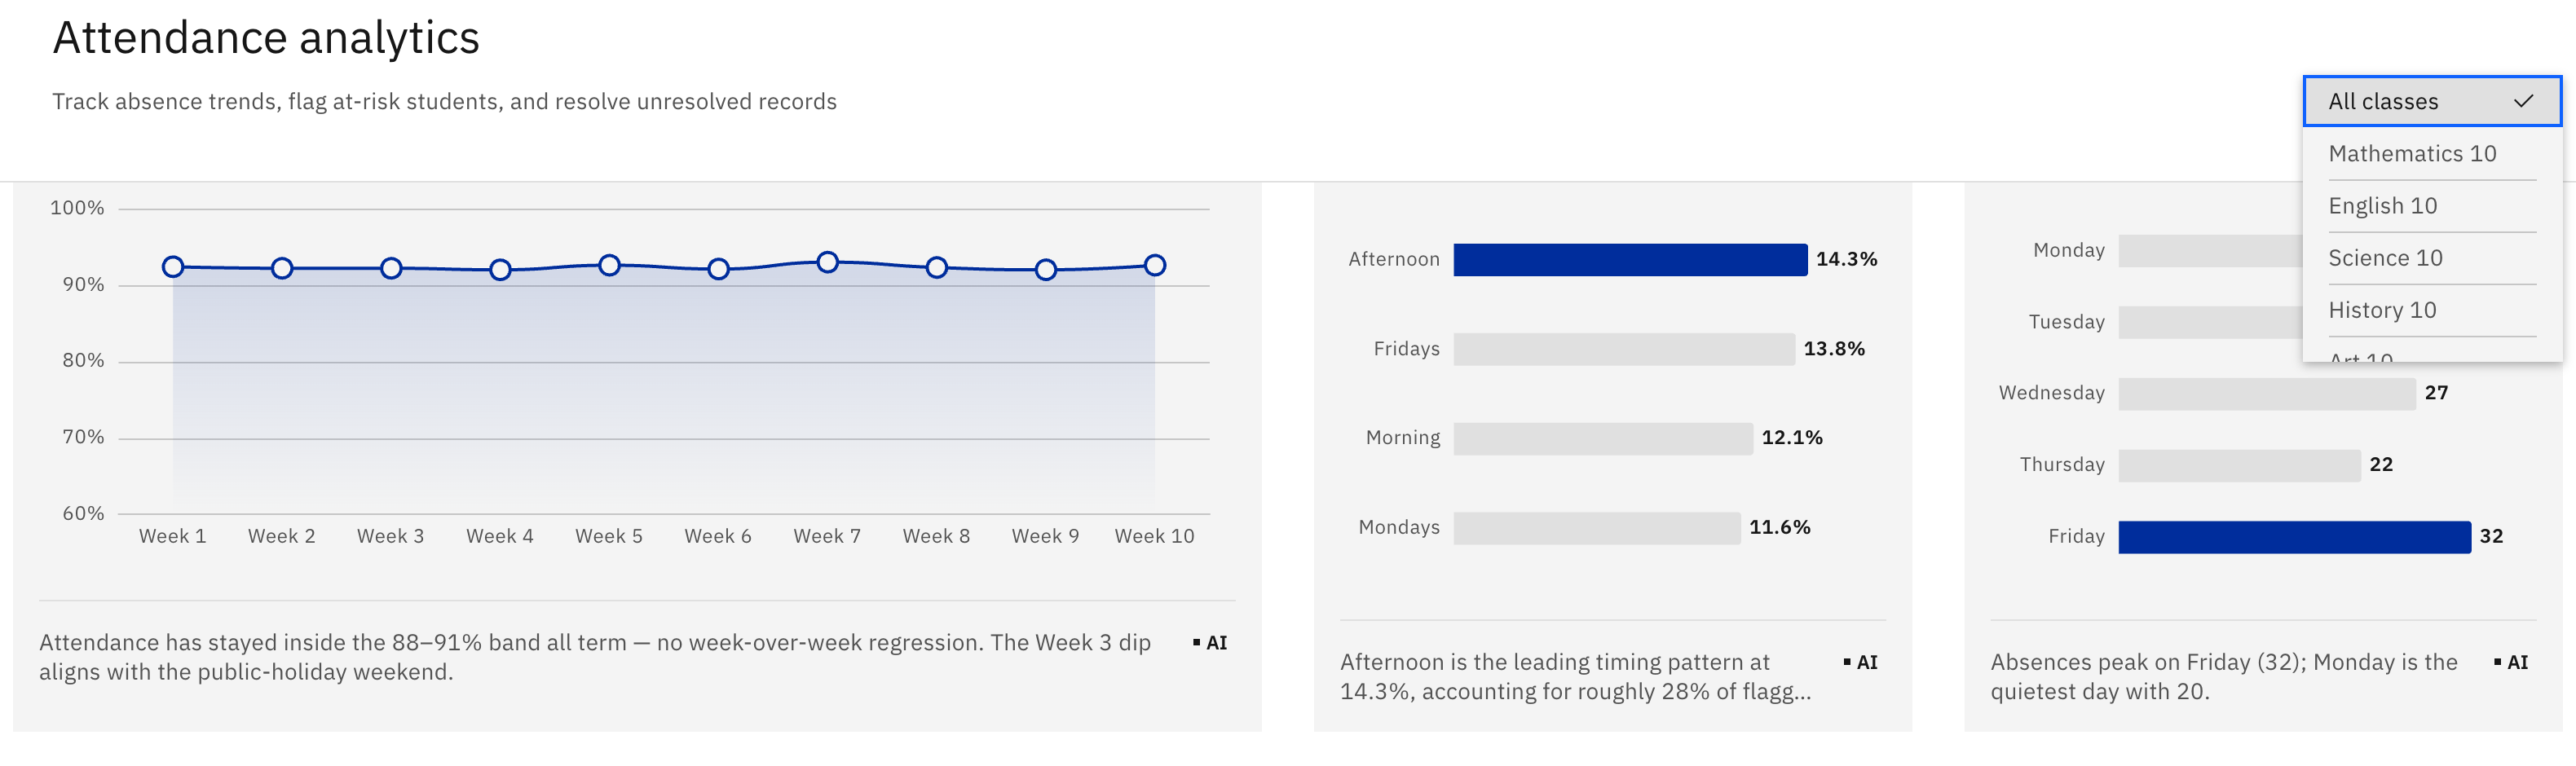
The Trends section holds an attendance trend line, an absence-timing chart, and an absence-by-day chart. Use the by class filter to focus the charts on a single class.
Work the at-risk table
The at-risk table lists flagged students. Filter it by year group and by risk level to narrow to the students you want to follow up.